
Halloween 2025 has a clear flavor shift. Across major outlets including the New York Times, sour is having a moment. The broader market reads the same way. Recent scans show non-chocolate gaining as October approaches, helped by price pressure on cocoa and the visual fun of bright, fruity formats. People’s recap of Circana data puts chocolate at 44% of seasonal candy for the 12 weeks ending Oct. 5, down from last year, with non-chocolate growing. (People.com)
What the numbers say in aisle
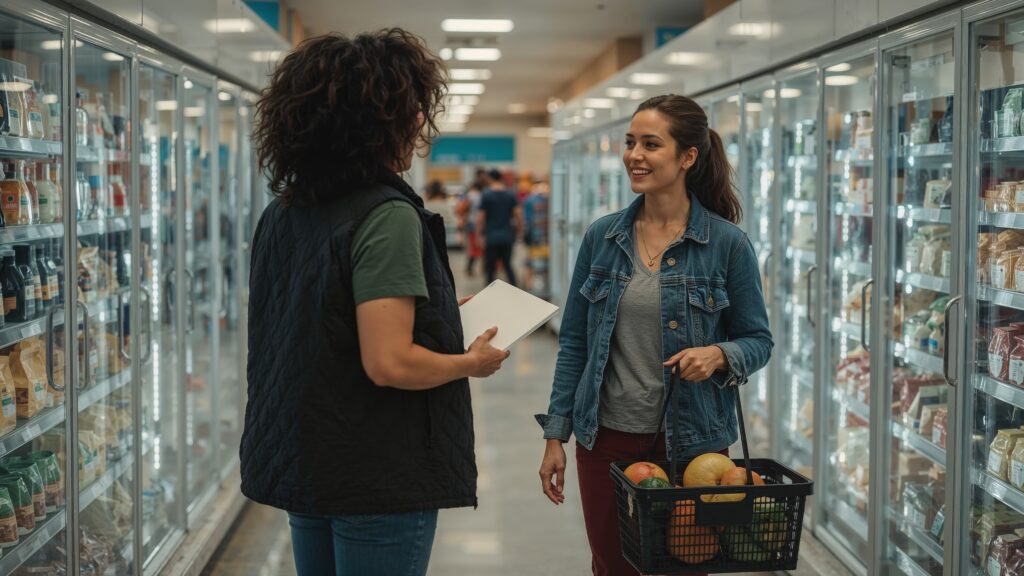
AP’s shelf view explains why baskets look different. In that same twelve week window, chocolate averaged about 8.02 dollars per pound while non chocolate averaged about 5.77. A clear price gap plus a taste for colorful formats helps explain why more carts hold gummies, belts, and fruit flavors. AP also notes that shoppers begin buying candy more than three weeks before October thirty one, with younger consumers starting even earlier. (AP News)
Circana’s trend line adds the backbone. Through mid September, non chocolate pound sales were up about 4.5 percent, while chocolate fell by double digits in the seasonal set. The data echoes what anyone sees on endcaps and in mixed bags across the month. (Circana)
Product news that fits the mood
Innovation headlines keep the set feeling new. This fall, Sour Patch Kids introduced Strips, a ribbon style candy meant to share and to post, a useful example of fruit forward ideas arriving exactly when value and visual novelty matter. (Allrecipes)
Younger shoppers show a stronger tilt to bright non chocolate formats and they tend to buy earlier. AP’s timing detail and price view match the scans that People cites from Circana which together show how a value sensitive year pushes more baskets toward fruit forward and sour choices. (AP News)
The map of where shoppers buy is widening
The channel picture is evolving alongside flavor. Retail Dive notes that more consumers plan to shop Halloween outside traditional stops. 14% say they will buy at home improvement stores up from 9% and 21% plan to buy at home decor stores up from 13%. 78% of shoppers expect to purchase decorations led by hanging lights and cobwebs then pumpkins and indoor or door decor. The season now stretches across weeks and spend is assembled across multiple trips. (Retail Dive)
A longer runway changes who shows up and when. Early planners build porches and yards first in home focused channels, then circle back for food and candy refills as events stack up late in October. That cadence matches the channel expansion above and helps explain why stores see repeat visits with different missions. Media coverage that once centered on costumes now spends just as much time on yard displays that photograph well for social sharing, which in turn pulls families back for one more candy top off before the big night. (Retail Dive)
How a data platform reads the moment
From a data platform perspective the takeaway is descriptive rather than prescriptive. Seasonality and demographics are the drivers. Younger shoppers show up earlier and gravitate to non-chocolate. Value-sensitive households respond to the per-pound gap. Décor-led projects pull the first trips into home-focused channels, then food and candy consolidate closer to the holiday. A modern personalization layer simply reflects those signals back to each visitor. It reads flavor tolerance, recognizes location and timing, and orders the same content differently for different households. The copy can stay simple. The page just feels relevant because it mirrors how the season actually unfolds. Personalization is not a pitch here. It is a description of how a data layer mirrors the season.
Sour is stealing Halloween 2025 and the personalization layer simply makes that moment easier to find.
Sign up for Updates
Stay current on the latest happenings at Birdzi!
"*" indicates required fields
Related Posts

Request a 1-on-1 Demo
There’s no substitute for seeing Birdzi’s capabilities first-hand with a seasoned expert to answer all your questions.
"*" indicates required fields